Loanology > Stats on SBA Loans
FRANCHISE STATS
ON SBA LENDING
Franchise Resource: Articles, Insights, Tips, Stats, and Musings
FRANCHISE LENDING INTEL
FranchiseLoan.io has everything and everyone needed for your franchise loan seamlessly connected in one place.
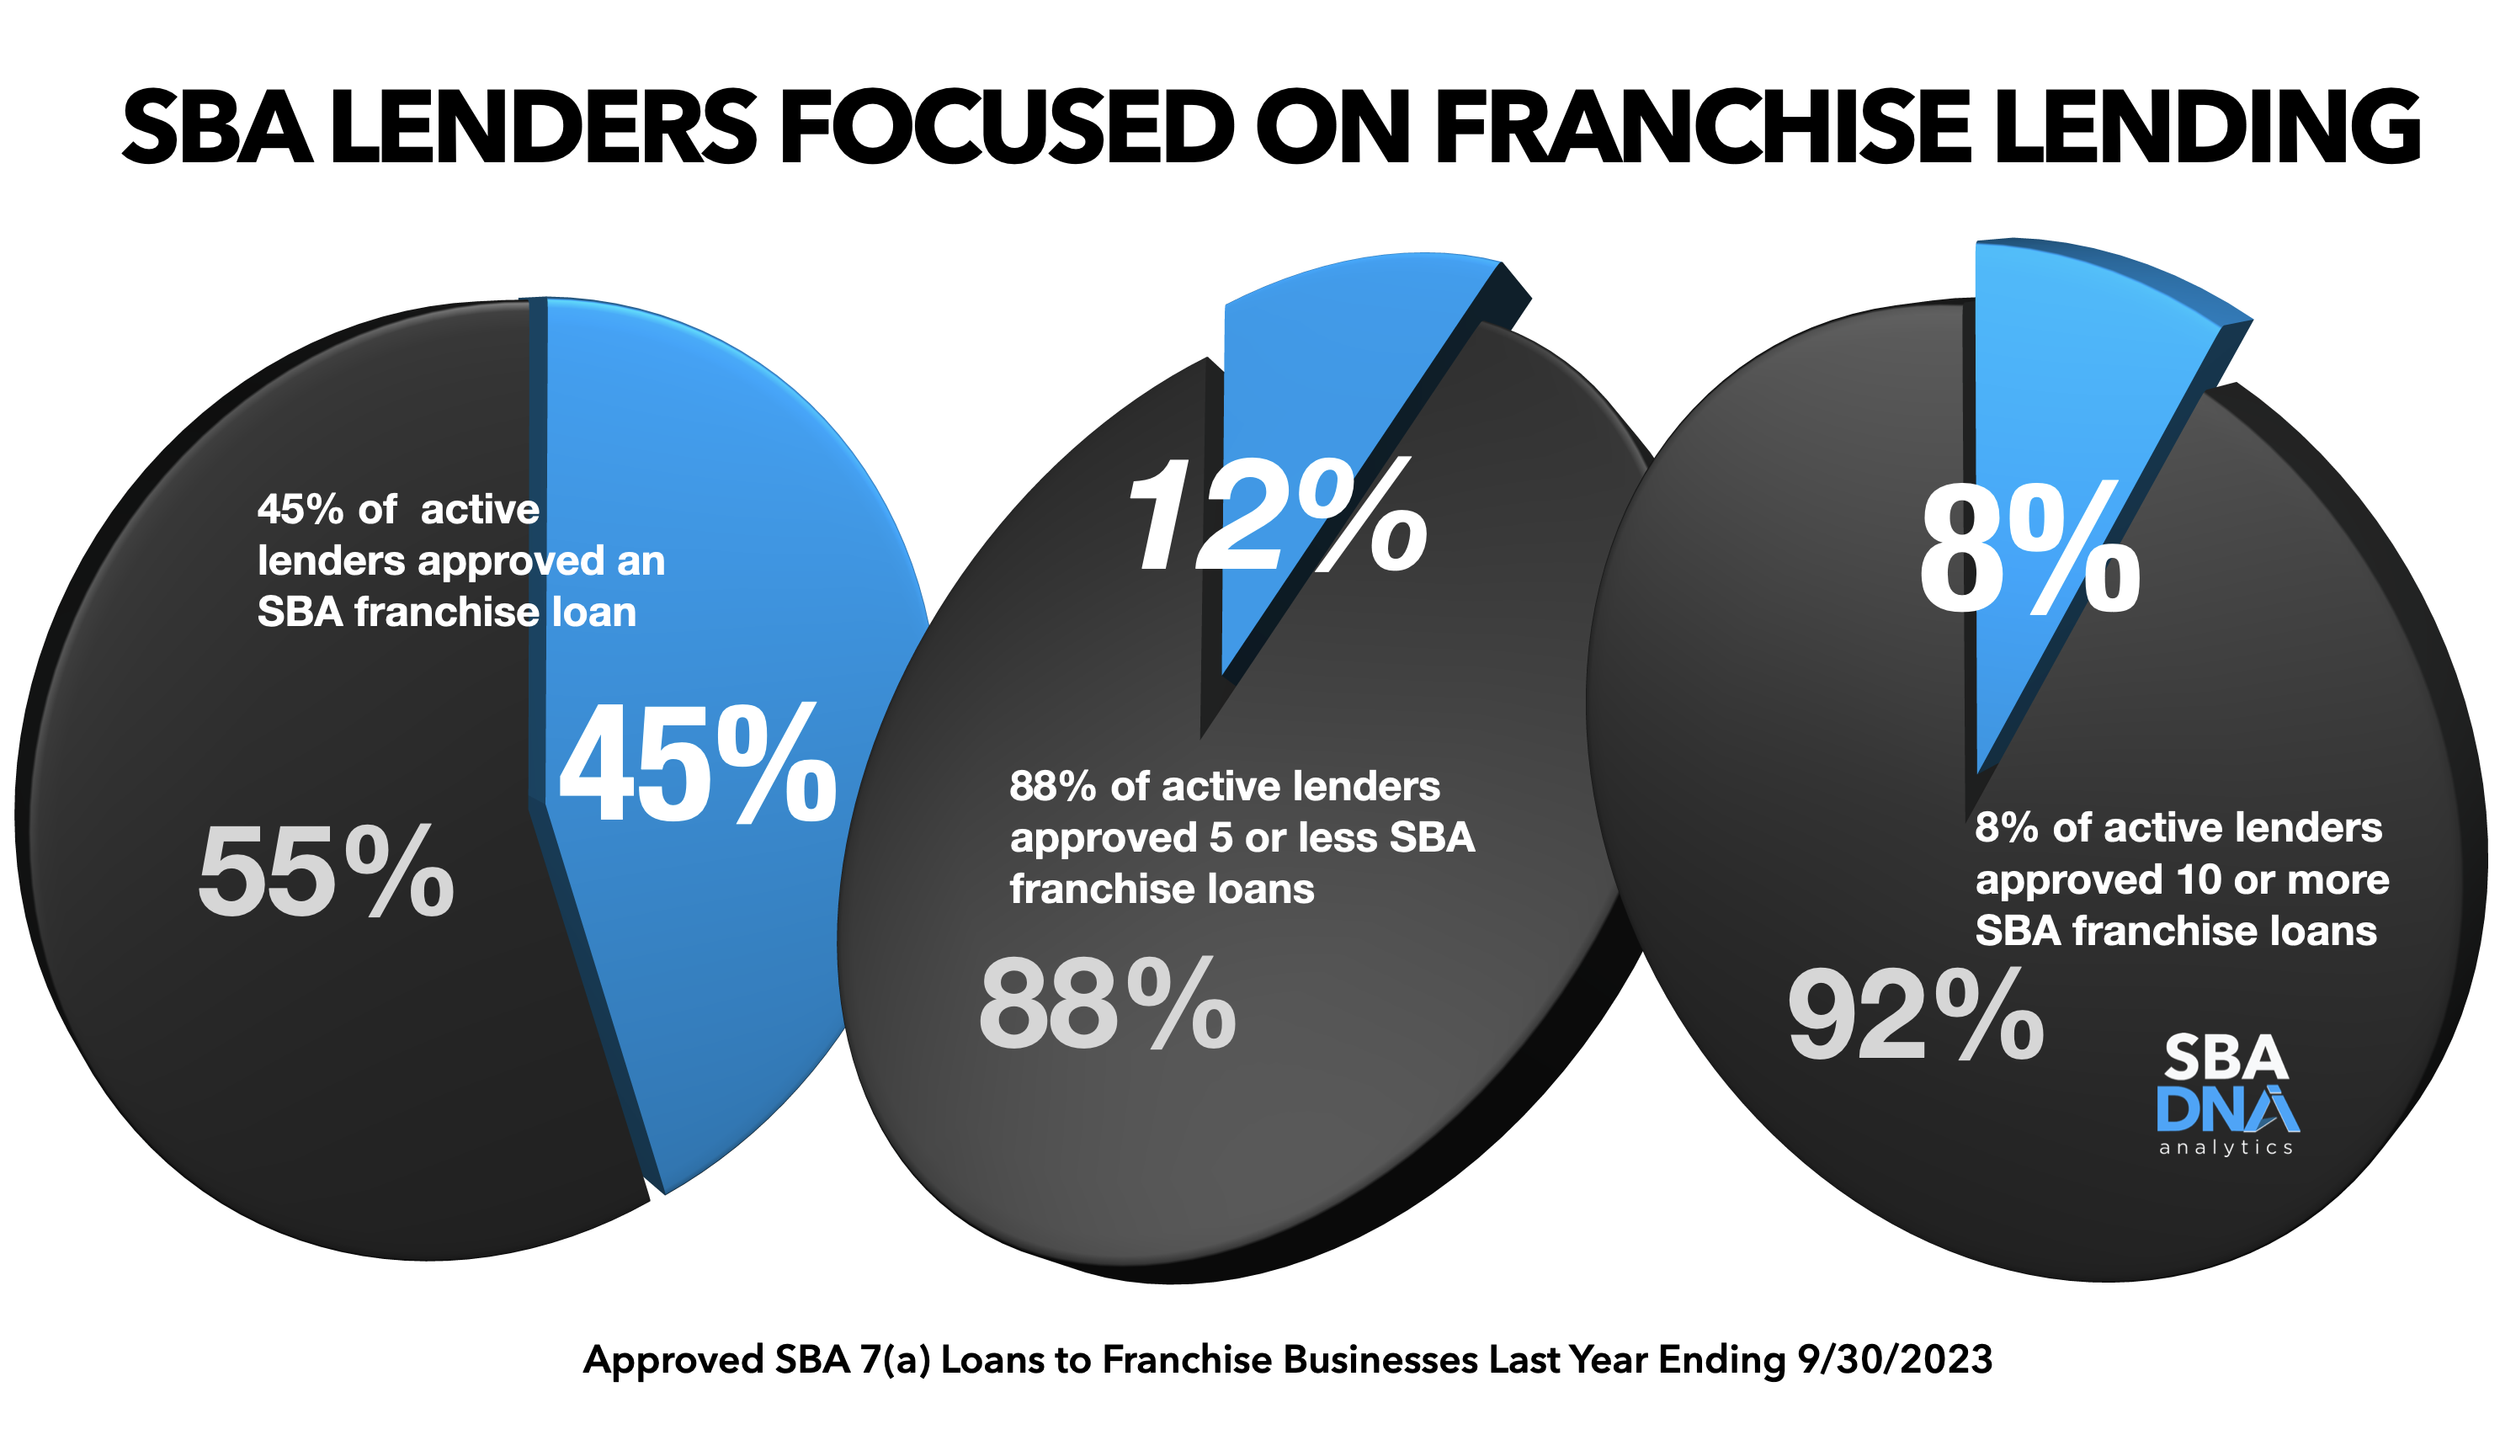
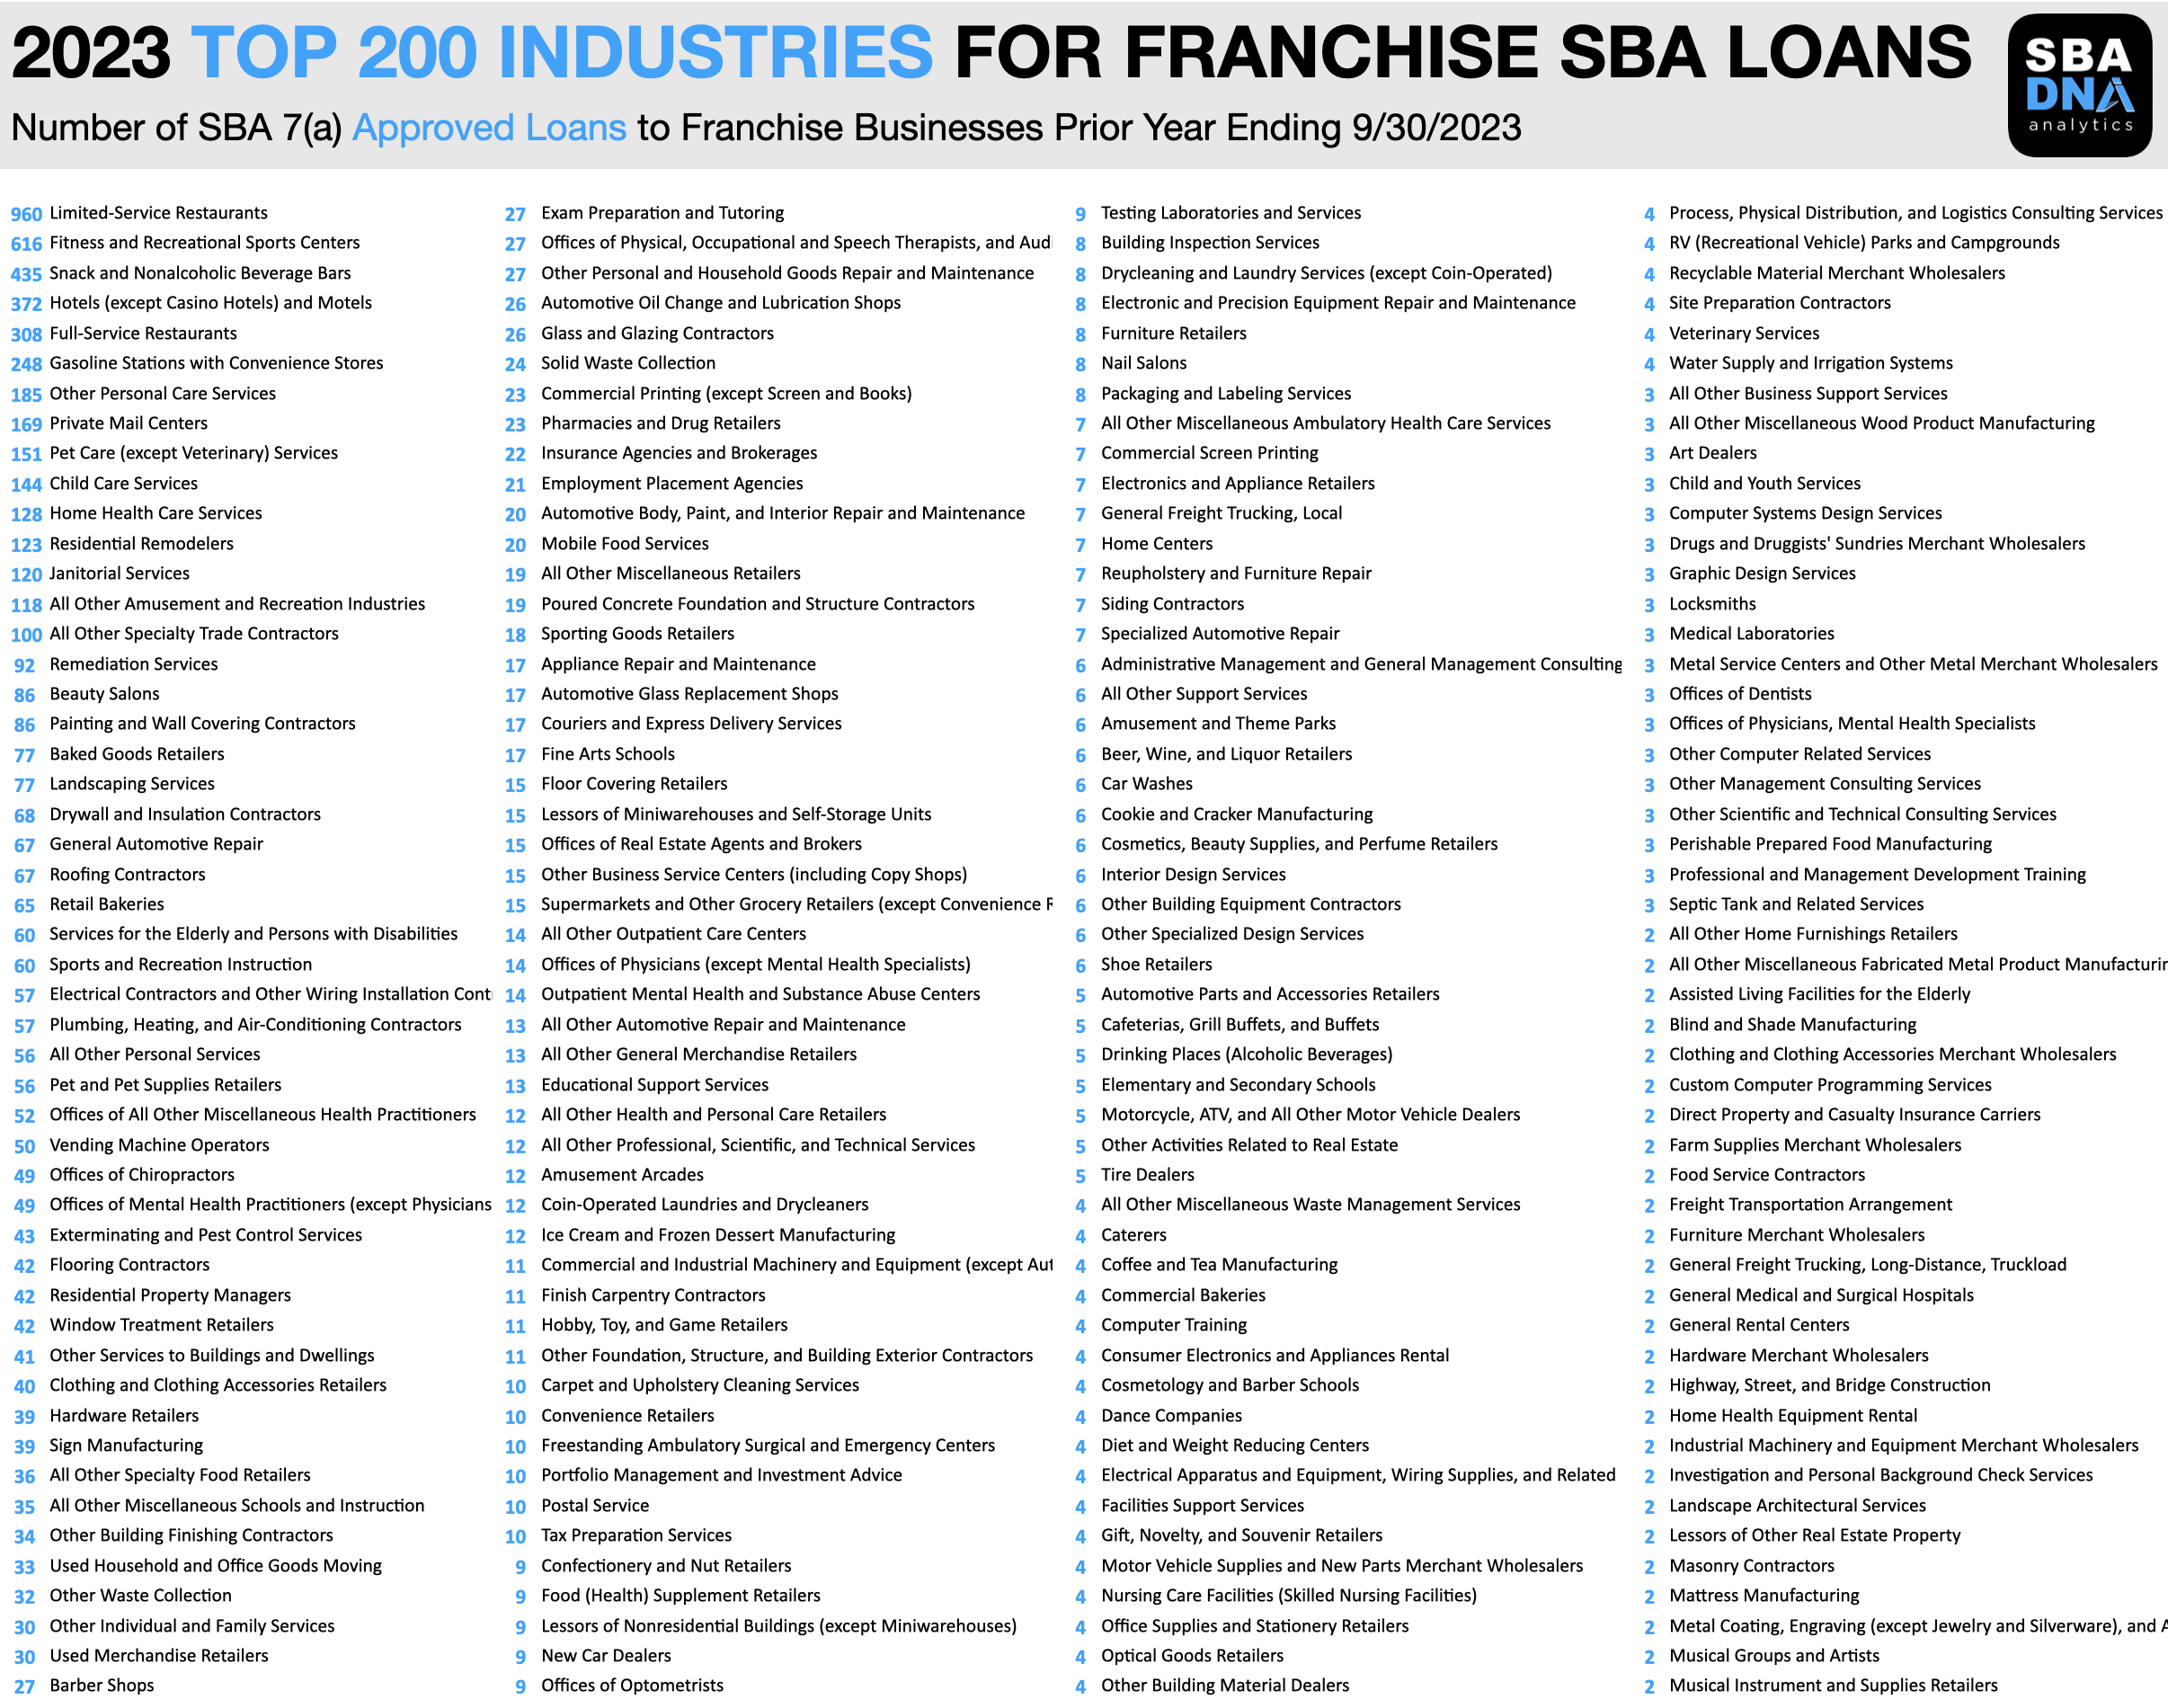
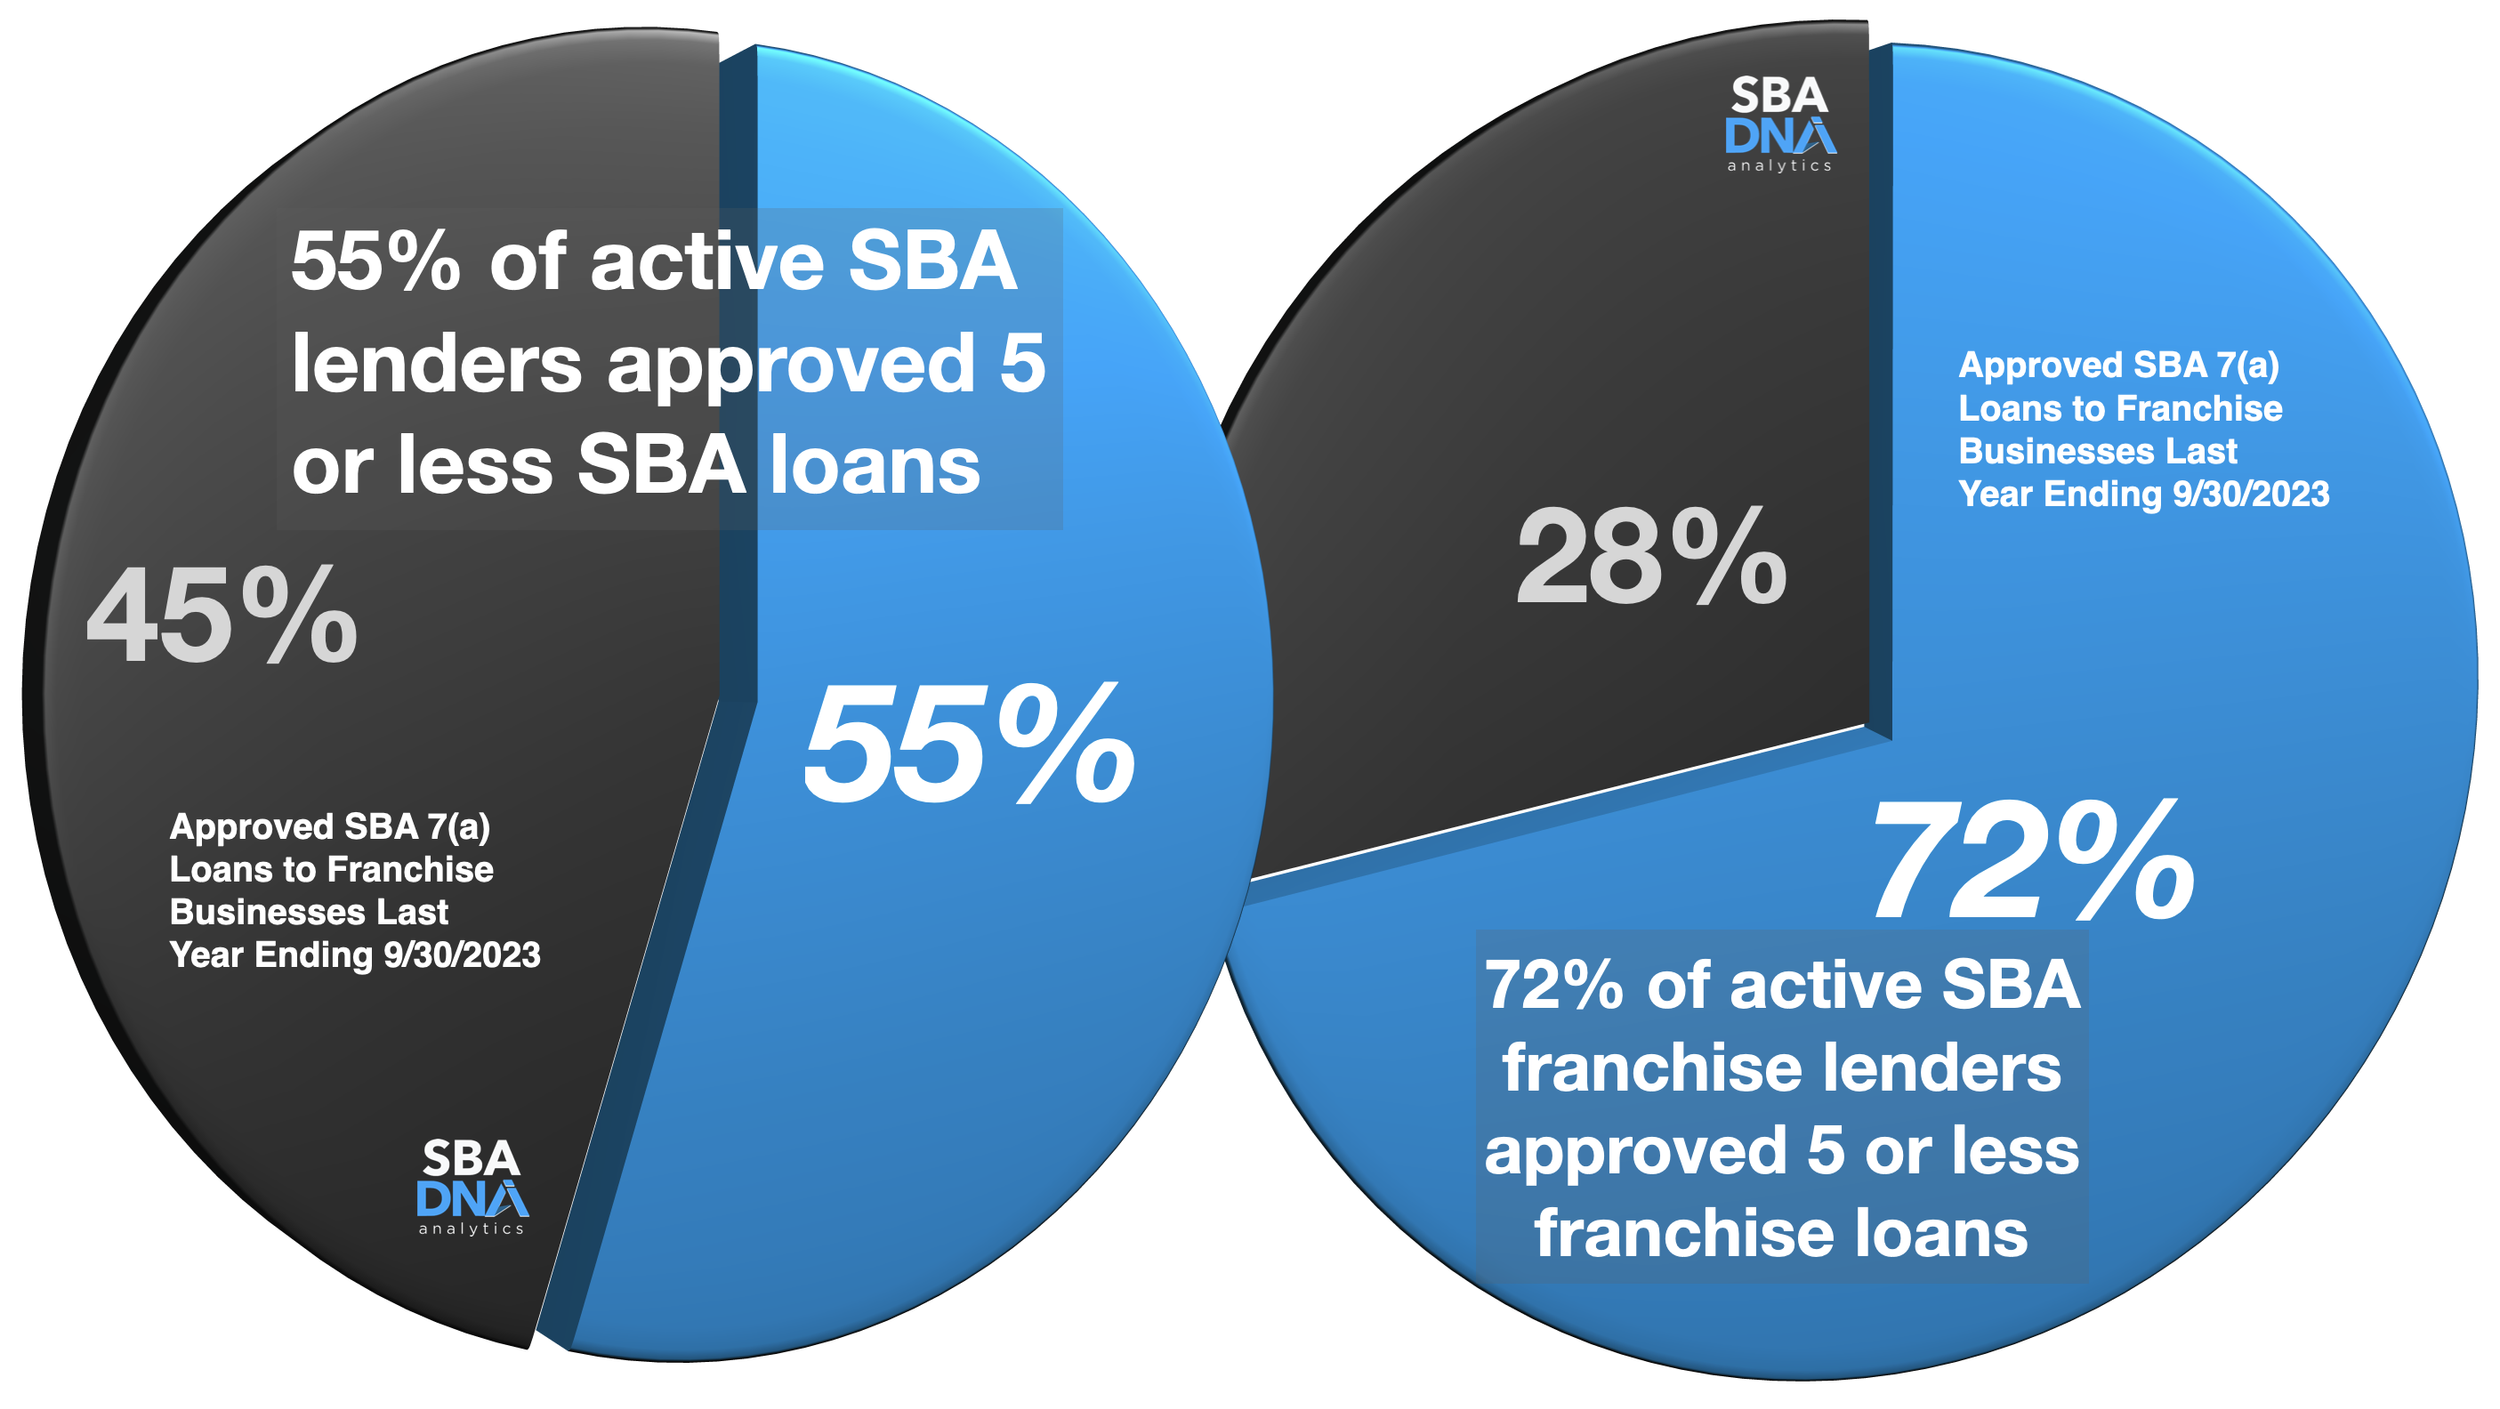
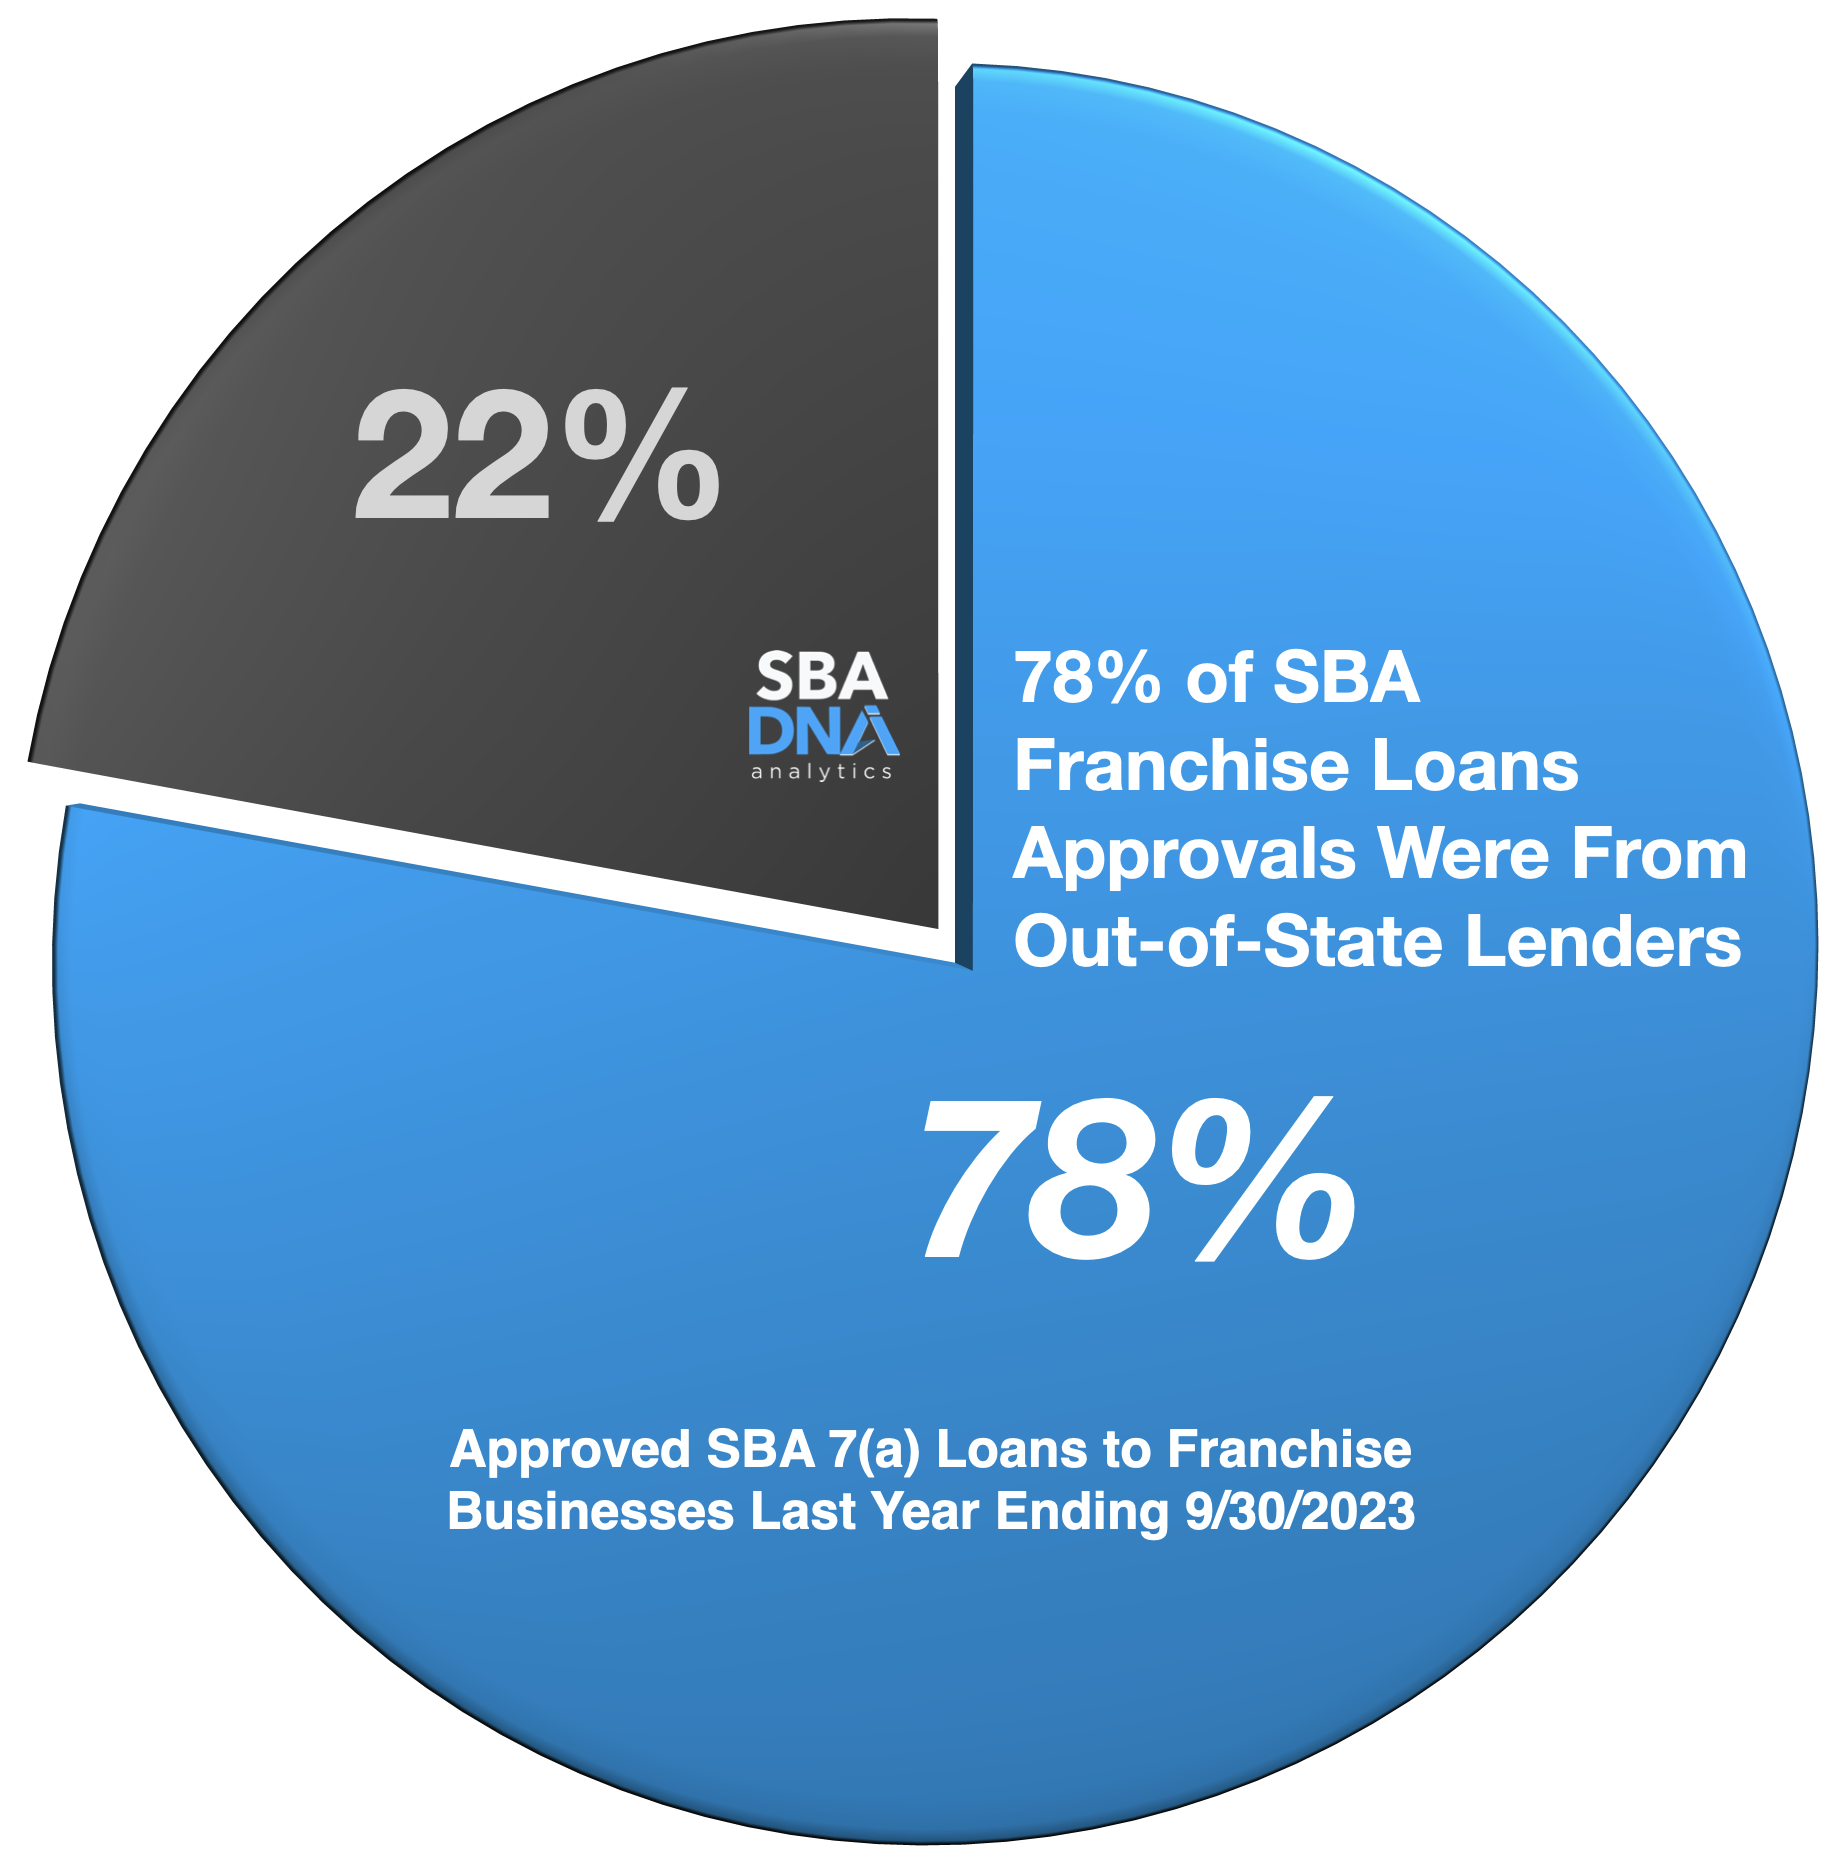
FY 2023 Funded Franchise SBA 7(a) Loans
Prior Year Ending 9/30/2023
575
SBA Lenders
Funded a Franchise Loan
1,310
Franchise Brands
had Funded Franchise Loans
259
Different Industries
had a Franchise Loan
$3.6 B
Funded Dollars
to Franchise Businesses
761K
Average Loan Amount
of Funded Franchise Loan
894
> $1 Million Loans
Franchise Loans Funded
4,741
Funded Loans
to Franchise Businesses
77%
Out-of-State Lenders
Funded Franchise Loans
25%
Change of Ownership
Funded Franchise Loans
2.14%
Average Bank Spread
for Funded Franchise Loans
1,954
Borrower Cities
of Funded Franchise Loans
38%
Startup Franchises
Funded Franchise Loans
Average SBA Interest Rates Over The Last Year:
Franchise vs. Non-Franchise Bank Spreads
2.58%
All Loans
Average Spread
2.28%
Franchise Loan
Average Spread
2.65%
Non-Franchise Loan
Average Spread
12 Month Average Bank Spreads
1.89%
In State Bank
2.27%
Loans < $1 Million
2.21%
Out-of-State Bank
1.55%
Loans > $1 Million
2.28%
Startup Franchise
2.56%
Loans < $150,000
1.75%
Change of Ownership
2.04%
Loans $500K to $1 Million
LOAN APPROVAL TO FUNDING CONVERSION
50%
All Franchise
50%
< $150,000
66%
< $350,000
86%
> $350,000
The percentage of all SBA 7(a) loan dollars for franchise loans converted from lender approving the loan to funding the loan. Loan approval status to disbursed status conversion during the 12 month period ending 6/30/2023.